Breast cancer cells damaged by chemotherapy accelerate tumor growth
Chemotherapy and radiation are basic cancer therapies aimed at reducing tumor burden. These toxic agents destroy both malignant and normal cells thereby increasing the population of dying cells and/or tumor debris and causing other changes in the tumor microenvironment. These dead cells can act as a source of stimulants on surviving tumor cells leading to recurrence of tumors, thereby reducing survival rates. We investigated the effects of docetaxel-induced debris of 4T1 cells—a murine breast cancer line—on breast tumor growth in female mice. Female athymic mice were divided into three groups. Group 1 was inoculated with 4T1 cancer cells, Group 2 with 4T1 cells mixed with 4T1 cell debris, and Group 3 with 4T1 cell debris alone. All mice were fed a regular chow diet. After four weeks, the mice were sacrificed, their tumors excised, weighed and processed for histology and immunohistochemistry, including cell proliferation, angiogenesis and inflammatory markers. Tumor weight and tumor burden were significantly higher in Group 2 mice compared to Group 1 (by 40% and 44%, respectively), while Group 3 mice developed no tumors. Although the basic tumor histology for Groups 1 and 2 were similar, there were significant differences in the expression of inflammatory and cell growth parameters between these groups. As such, tumors developed in mice injected with 4T1 cells together with cell debris (Group 2) had more intense staining pattern for TNF-alpha, Il-6, iNOS, KI67, VEGF, MMP2, and MMP9, compared to the Group 1 mice (injected with cancer cells only). Our results confirm that breast cancer cells damaged by the chemotherapy agent can accelerate tumor growth, accompanied by higher expression of pro-inflammatory cytokines and the MMPs which are associated with extracellular matrix damage, angiogenesis and other tumor-promoting events. These studies demand a new and critical look into chemotherapy and radiation in cancer treatment and managing tumor growth.
Introduction
Key therapeutic approaches in most cancer types—chemotherapy and radiation—aim at killing tumor cells, thereby reducing the tumor mass and tumor burden. However, the resulting accumulation of dead and dying cells in a tumor causes changes in tumor microenvironment affecting cancer progression. An intriguing clinical observation by Revesz in 1956 that tumor cells killed by X-ray stimulated growth of admixed viable cells unfortunately did not attract substantial research interest that would lead to unraveling molecular mechanisms involved in this phenomenon, until many years later.1 Understanding these aspects is necessary to the design of chemotherapeutic and radiation therapeutic modalities.
Some recent studies on the “Revesz phenomenon” identified cell debris generated by radiation and/or chemotherapy as tumor-promoting agents in colon and some other cancers.2,5 A study following in this direction also showed that the 5FU-generated colon cells debris can promote tumor growth and recurrence of cancer by affecting expression of osteopontin, as well as caspase-3-induced pro-angiogenic factors.2,3 A 2019 study published by Keklikoglou et al. confirms pro-metastatic effects of cytotoxic drugs broadly used in pre-operative (neoadjuvant) breast cancer therapy, such as taxanes and anthracyclines.4
We further investigated possible metabolic effects associated with toxicity of chemotherapy by studying breast tumor growth in female athymic nude mice injected with murine breast cancer cell 4T1 debris generated by the chemotherapeutic agent docetaxel compared to 4T1 cancer cells alone. The results of our study indicate that docetaxel-generated 4T1 cell debris accelerated the growth of breast cancer tumors in mice. The stimulation of tumor growth was associated with an increase of inflammatory cytokines TNF-alfa, IL-6, and iNOS, and other factors associated with tumor growth such as proangiogenic VEGF, and ECM-degrading enzymes involved in cancer cells invasion and metastasis (MMP-2 and MMP-9). The cell debris themselves were not effective in initiating tumor growth in mice during the time of the study.
Methods
Cancer cell line and culture
The murine breast cancer cell line 4T1 was obtained from ATCC (American Type Culture Collection, Rockville, MD, USA). The 4T1 cells were maintained in DMEM supplemented with 10 percent fetal bovine serum, 100U/ml penicillin and 100 mcg/ml streptomycin. The media and sera used were obtained from ATCC. Penicillin and streptomycin were obtained from Gibco BRL (Long Island, NY, USA). Docetaxel was purchased from Sigma (St-Louis, MO, USA).
In vivo studies
Animals
Five/Six-week-old female athymic nude mice were purchased from Simonsen Laboratory (Gilroy, CA, USA). On arrival they were maintained in micro isolator cages under pathogen-free conditions on a 12hr light/12hr dark schedule for one week. All procedures were carried out according to humane and customary care. We followed the protocols approved by the Internal Institutional Animal Safety Committee. All the animals had free access to unlimited amount of regular Purina chow diet and water.
Breast cancer 4T1 cells and Docetaxel-generated debris
Culturing of 4T1 cells
4T1 breast cancer cells were cultured in T-175 flasks in complete media. At near confluence the cells were trypsinized, centrifuged at 4oC at 1500 rpm for 10 minutes. They were washed twice with sterile PBS. The pellet was suspended in PBS and counted.
Induction of 4T1 cell debris by Docetaxel
4T1 cells were cultured in T-175 flasks in complete media. At near confluence, the cells were treated with 50 mcg/ml docetaxel in complete media for 72 hrs at 37oC in a tissue culture incubator equilibrated with 95% air and 5% CO2. The dead floating cells were carefully collected and centrifuged at 1500 rpm for 10 minutes at 4oC. The supernatant was then carefully aspirated, the cells were counted and checked with trypan blue for any live cell contamination, washed twice with 10 ml sterile PBS and the debris—dead cells monitored as trypan blue positive cells—were suspended in PBS.
Experimental design
Female athymic nude mice were divided into 3 groups. Group 1 was inoculated with 4T1 cells 0.25×10⁶ in 100 mcl PBS into the mammary pad; Group 2 was inoculated with a mixture of 4T1 untreated cells (0.25×10⁶ cells) and 4T1 debris (1×10⁶ cells) in 100 mcl PBS and Group 3 was inoculated with 4T1 debris only (1×10⁶) suspended in 100 mcl PBS in the mammary pad. After inoculation the mice were returned to their cages and fed a regular Purina chow diet and water. After 4 weeks the mice were sacrificed and their tumors were excised, weighed and processed for histology and immunohistochemistry. Animal weights were recorded before inoculation and at the time of sacrifice.
Dimensions (length and width) of the tumors were measured using a digital caliper and the tumor burden was calculated using the formula: length x width.
Histology & Immunohistochemistry
Tumor tissue samples were fixed in 10% buffered formalin and sent to IDEXX Reference Laboratories for processing, blocking, sectioning and staining with hematoxylin and eosin (H&E). Tumor morphology was evaluated using a standard light microscope. The staining for inflammatory, cancer and ECM markers were carried out by Histotox Lab Inc. (Boulder, CO).
Results
Body weight
Figure 1 shows changes in the body weight of mice in 3 experimental groups. The mean body weight of the mice increased at the end of the study and it did not significantly differ between the control and 2 test groups.
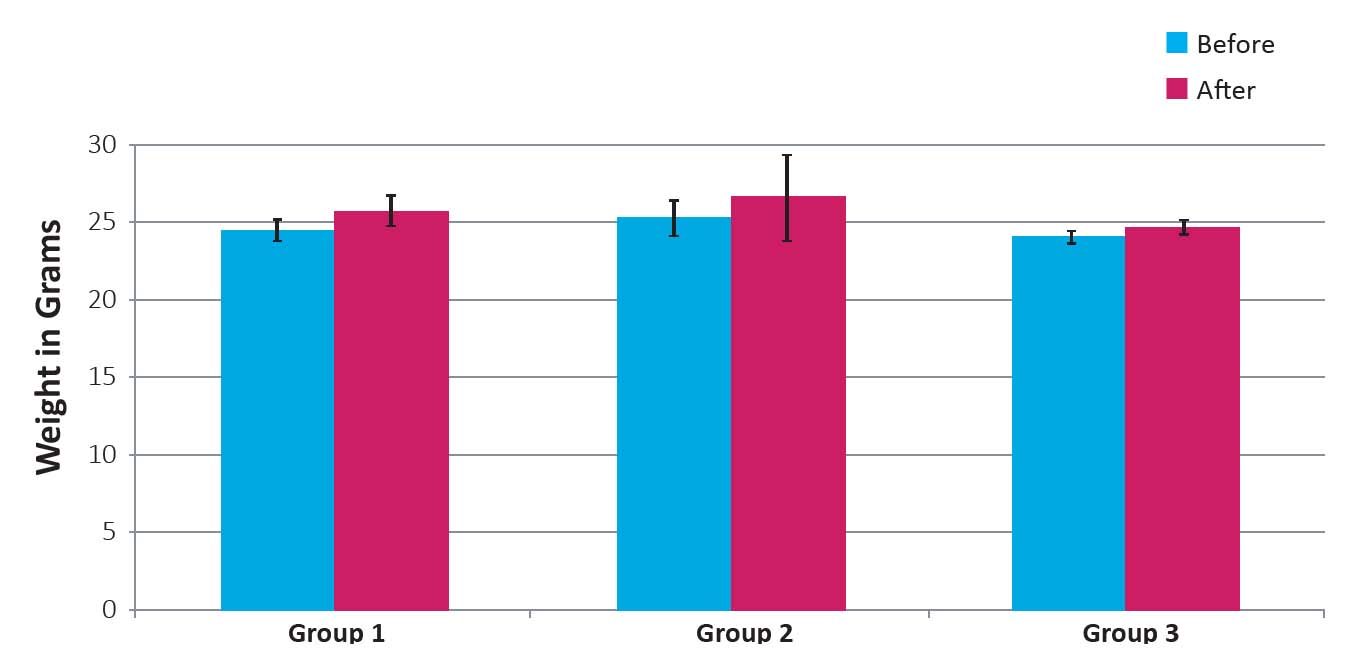
Figure 1: Weight of mice before and after four weeks following inoculation with 4T1 cells and 4T1 cells plus debris
Tumor weight and tumor burden
As shown in Figures 2A and B, the mean weight of tumors developed in animals in Group 1 was 2.3± 0.4 g and in Group 2 it was 3.2 ±0.43 g (p < 0.01). Tumor burden in Group 1 mice was 230 ±13 cm2 and in Group 2 it was 332 ±12 cm2 (p < 0.01). These results show that both tumor weight was higher by 40% and tumor burden by 44% compared to the control Group 1 and tumor burden was significantly higher in Group 2 mice compared to Group 1. Mice in Group 3 did not develop any tumors. Photographic images of tumors developed in mice in group 1 (injected with 4T1 cells) and 2 (injected with 4T1 cells plus chemotherapy-damaged cell debris) are shown in Figure 3.
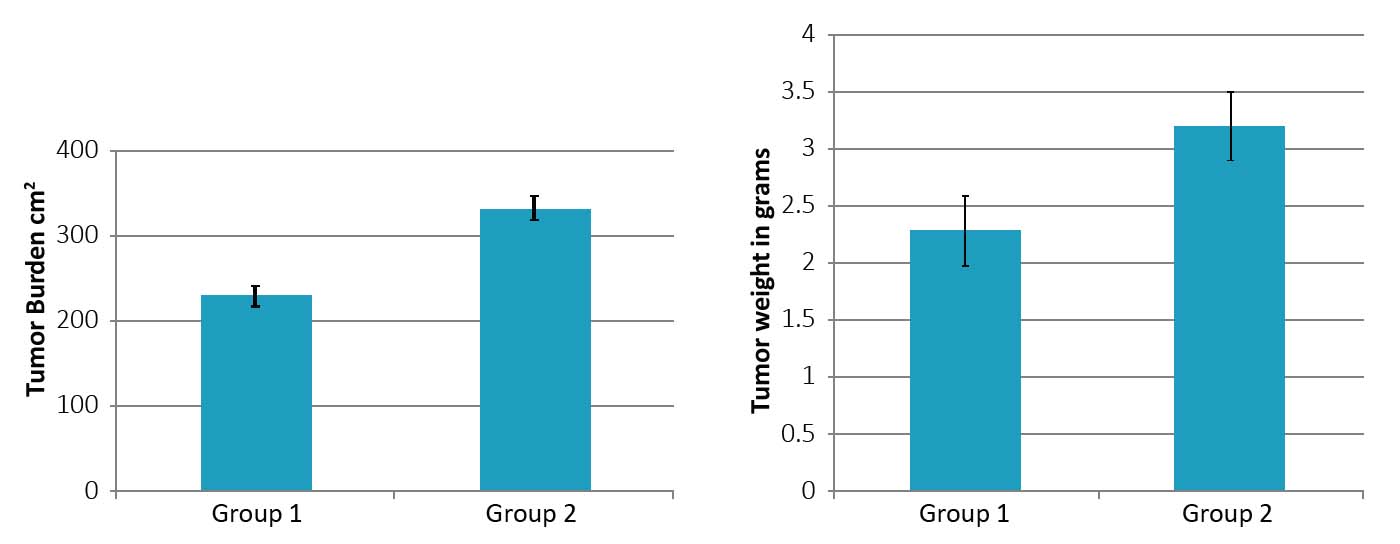
Figure 2: Tumor burden (A) and tumor weight (B) in Group 2 mice as compared to Group 1. (* significance = 0.01)
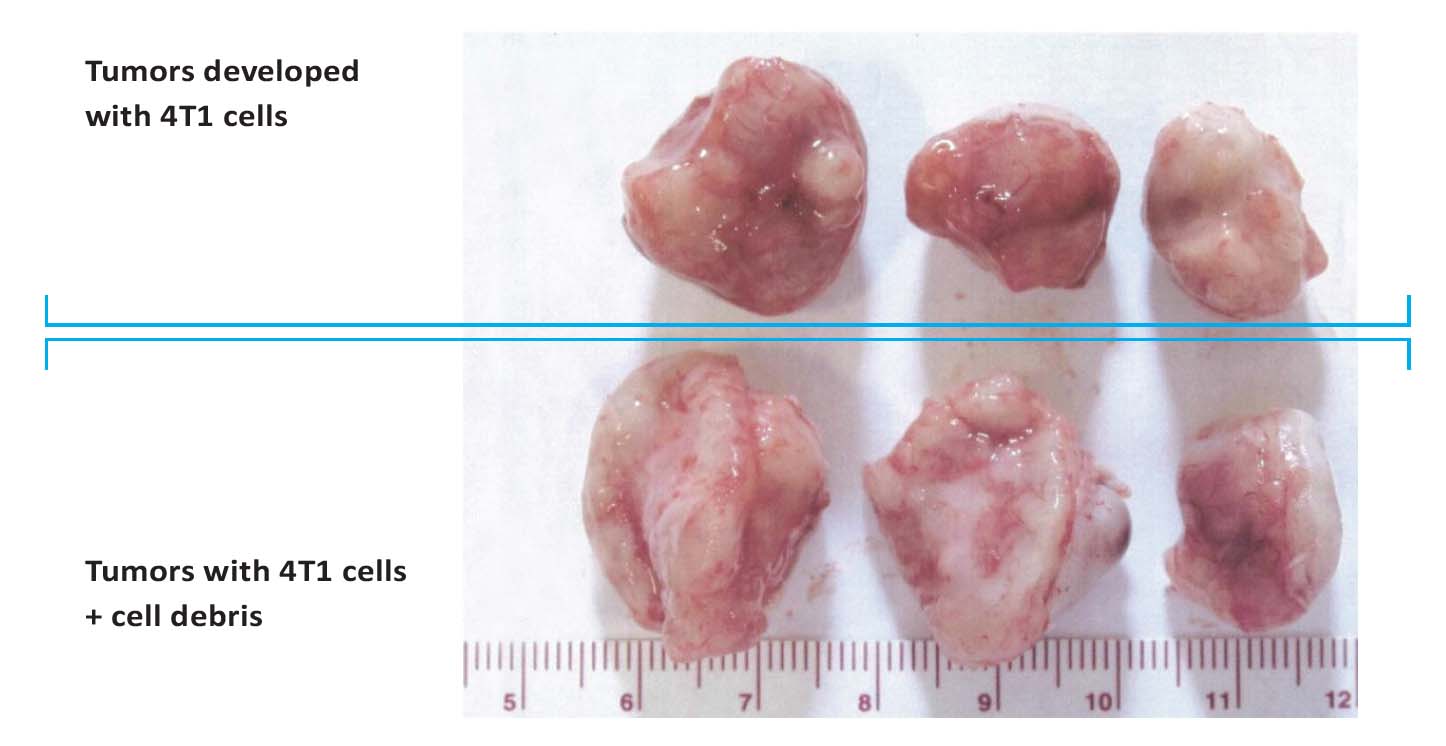
Figure 3: Photographs of tumors developed in mice injected with 4T1 breast cancer cells (top row) and injected with a
combination of 4T1 breast cancer cells plus cell debris resulting from Docetaxel treatment (bottom row).
Tumor histopathology
The results presented on Figs 4A and 4B show that H&E staining images of tumors in both groups were similar. Other histology evaluation showed that in both animal groups there was an irregularly round subcutaneous tumor necrosis involving about 60% of the tumor mass. In tumors developed in mice in Group 1 the neoplasm was composed of sheaths of irregular round to spindle-shaped cells with round to oval-shaped nuclei and a poorly defined cytoplasmic border, with mitotic figures ranging 1-3 per high power field. In Group 2 the neoplastic cells were somewhat larger than Group 1 with mitotic figures ranging from 1-4 per high power field.
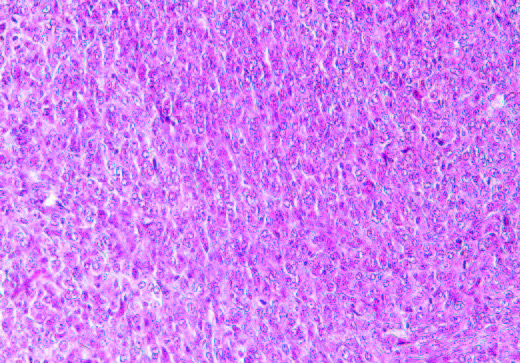
4A- Group 1
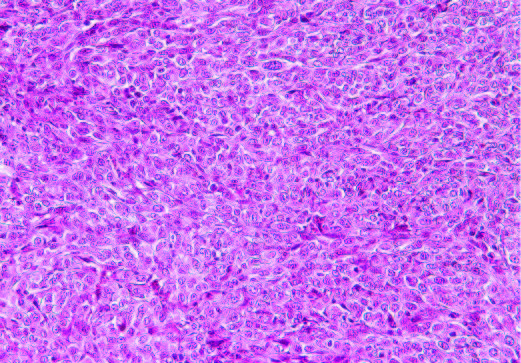
4B- Group 2
Figure 4: H&E staining of tumors in group 1 (A) and Group 2 (B)
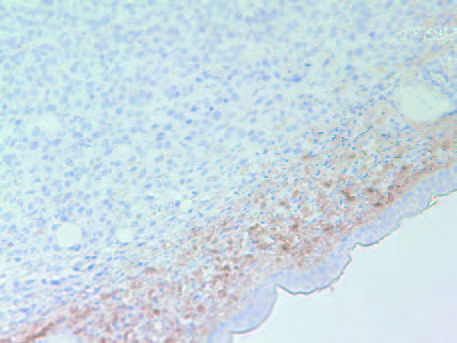
The tumors in Group 2 (B) had similar intense staining pattern for collagen I and collagen IV internally as presented in Figure 5 and Figure 6, respectively. The fibrous capsule around the tumor appeared as having more irregular distribution of collagen IV in Group 2, compared to Group 1 (A).
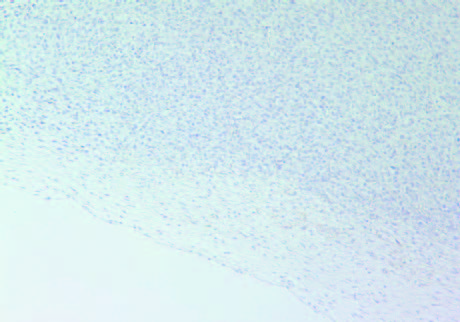
5A- Group 1 (Collagen I)
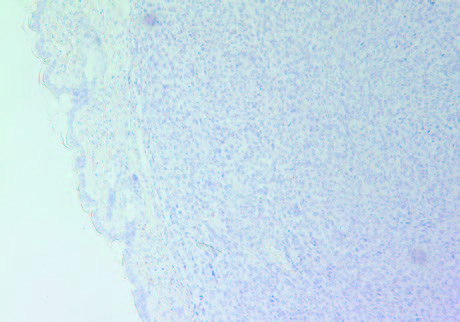
5B- Group 2 (Collagen I)
Figure 5: Collagen I staining of tumors in Group 1 (A) and Group 2 (B).
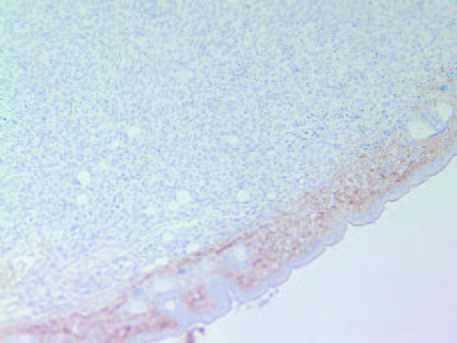
6A- Group 1
6B- Group 2
Figure 6: Collagen IV staining of tumors in Group 1 (A) and Group 2 (B).
Tumor immunohistochemistry
As shown in Figures 7A and 7B the cell proliferation marker Ki67 had higher intensity and frequency of staining in tumors originating from Group 2 mice compared to Group 1.
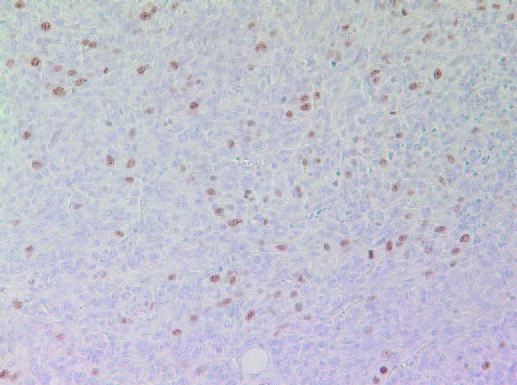
7A- Group 1 tumor
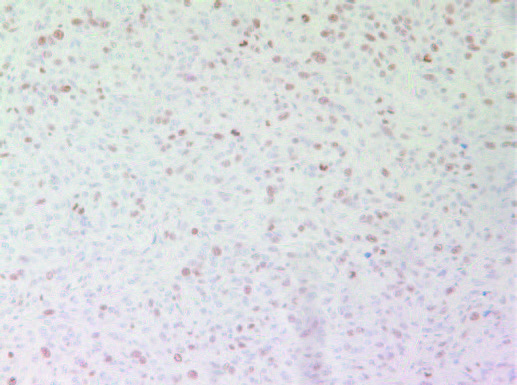
7B- Group 2 tumor
Figure 7: Proliferation marker Ki67 in tumors developed in mice in Group 2 and Group 1
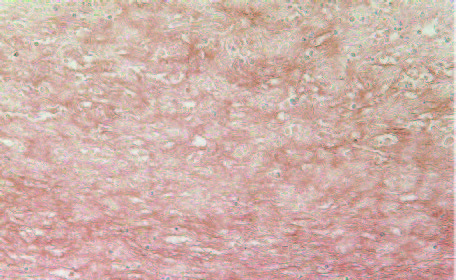
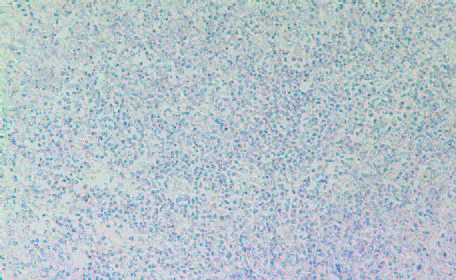
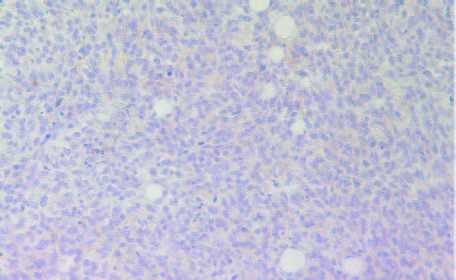
Among the inflammatory parameters that have been associated with tumor growth and expansion we observed that tumors developed in Group 2 mice had higher expression of cancer-promoting cytokines TNFalpha (Fig 8A and 8B) compared to tumors developed in Group 2 mice. A similar pattern was observed in expression of another pro-inflammatory cytokine, Il-6 (Figures 9A & 9B). It was higher in Group 2 tumors compared to tumors in Group 1.
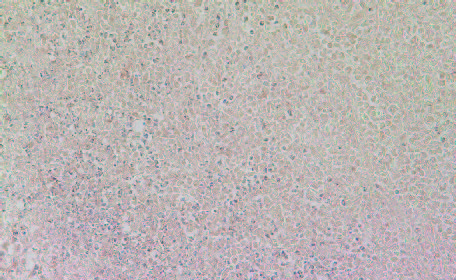
8A- Group 1
8A- Group 1
Figure 8: Histology staining for the presence of TNF-alpha in tumors developed in Group 2 and Group 1
9A- Group 1
9B- Group 2
Figure 9: Histology staining for the presence of IL-6 in tumors developed in Group 2 and Group 1
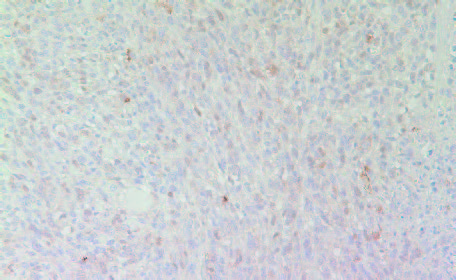
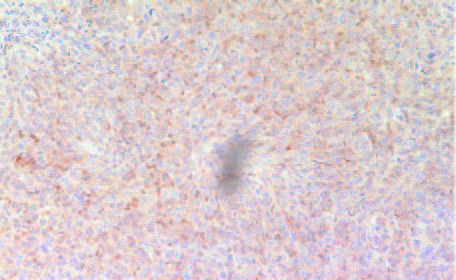
The expression of iNOS—calcium-independent inducible isoform of Nitric Oxide (NO) shown to be expressed in many tumors—was higher in tumors derived from Group 2 mice compared to Group 1 tumors (Figures 10A and 10B).
10A- Group 1
10B- Group 2
Figure 10: Expression of iNOS in tumors developed in Group 2 (A) mice and Group 1 (B)
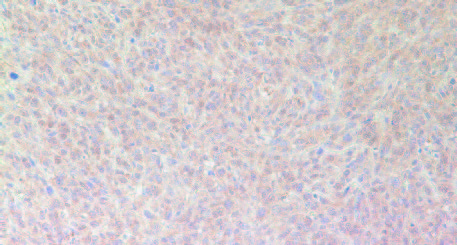
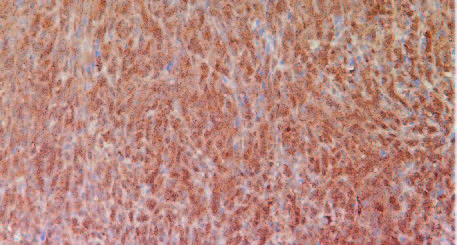
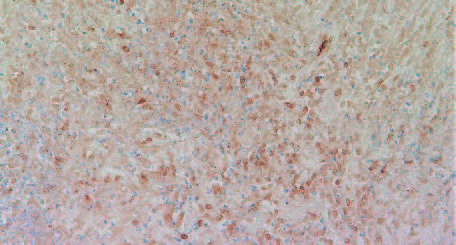
The results in Figure 11 present immunostaining results of representative tumors for VEGF (A), MMP-2 (B) and MMP-9 (C), the factors associated with promotion of angiogenesis, tumor growth and metastatic potential. The results show that tumors developed in Group 2 mice have significantly more intense staining pattern for VEGF, MMP2 and MMP9 as compared to Group 1.
A: VEGF
VEGF in Group 1
VEGF in Group 2
B: MMP-2

MMP-2 in Group 1
MMP-2 in Group2
C: MMP-9
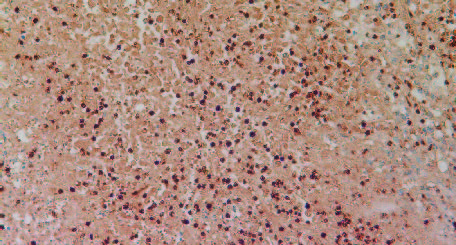
MMP-9 in Group 1
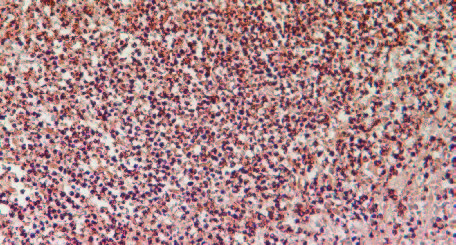
MMP-9 in Group 2
Figure 11: Tumors developed in Group 2 mice (injected with 4T1 cells plus debris) had more intense pattern for VEGF, MMP2
and MMP9 as compared to Group 1 mice (injected with 4T1cells only).
Discussion
Comprehensive understanding of the effects of chemotherapeutic agents and radiation is critical in designing effective therapeutic methodologies based on these approaches and assess realistic prognosis of the course of a disease. In our study we examined metabolic impacts of chemotherapy-damaged cancer cells on breast cancer development in vivo.
Our study demonstrates that the cell debris of 4T1 murine breast cancer cell line generated by chemotherapeutic agent docetaxel and co-injected with breast cancer cells significantly promoted tumor growth. Compared to tumors developed in mice injected with cancer cells only, co-injection of tumor debris increased both tumor weight and burden by 40% and 44%, respectively. Interestingly, the cell debris alone did not trigger tumor growth during the 4-week observation time.
As anticipated, the tumor cell debris aggravated inflammatory response as indicated by elevated secretion of cytokines TNF-alpha and Il-6, thereby confirming earlier observation by Sulciner.5 Tumor necrosis factor-alpha (TNF-α) is an important multifunctional inflammatory cytokine with pleiotropic effects, involving among others regulation of apoptosis, affecting survival and immune responses.2,5 In addition, 4T1 tumor cells debris stimulated the expression of pro-inflammatory protein iNOS. Breast carcinoma cells, in addition to stromal cells, express iNOS and are capable of producing NO. Carcinomas with iNOS positive tumor and stromal cells have higher apoptotic indices and increased vascularization, suggesting that iNOS contributes to promotion of apoptosis and angiogenesis in breast carcinoma.6,7 High NO levels that produced cytotoxic effects in tumor cells are derived from macrophages, neutrophils, endothelial cells, and other cells.
Docetaxel-induced dying cells/cell debris affected the tumor microenvironment resulting in higher cell proliferation as indicated by increased levels of Ki57, a cell proliferation marker. Interestingly, the evaluation of mitotic figures in tumors indicated only slightly higher number in Group 2 mice tumors compared to Group 1 (1-4 vs 1-3 mitotic figures per high power field).
Tumors developed in mice exposed to 4T1 tumor cell debris also showed increased staining for proteolytic enzymes MMP-2 and MM-9 and pro-angiogenesis factor VEGF compared to tumors developed in mice injected with cancer cells only. These observations clearly indicate that tumor cell debris-associated inflammation and other metabolic changes accelerate ECM damage, which accompanies tumor progression and metastasis and can contribute to tumor relapse.
Our study also shows increased staining for collagen I and IV both internally and in the fibrous tumor capsule in tumors developed by co-injection of cancer cells with docetaxel-induced debris (Group 2). Collagen IV is a principal component of epithelial basement membranes where it exists in sheet-like network. Immunochemistry staining for Collagen IV appeared more dispersed in tumors in Group 2 (co-injected with cell debris) than in Group 1 (cancer cells alone), which would suggest higher damage to extracellular proteins in tumors with a higher population of dead cells. Increased proteolytic activity in the debris-derived tumors is also indicated by higher MMPs activity, an indicator of higher metastatic potential.
The results of our study confirm earlier findings and show that conventional chemotherapy and targeted therapy can directly contribute to tumor progression and relapse as tumor cell debris stimulates the growth of surviving tumor cells. Chemotherapy-generated tumor cell debris can promote tumorigenesis by stimulating the release of pro-inflammatory cytokines and pro-angiogenic and pro-metastatic factors. These observations from our studies as well as others raise an important question regarding the real efficacy of chemotherapy and radiation as key modalities in cancer therapy. It calls for intensifying research efforts in how to find a balance between tumor cell death and tumorpromoting activity of dying tumor cells and their toxic debris. Understanding these two opposing effects is crucial and timely as millions of cancer patients undergo chemotherapy and radiation treatment every year.
References
- Revesz L. Effect of tumor cells killed by X-ray upon growth of admixed viable cells. Nature.1956;178:1311-1392.
- Chang J, Bharsen SS, Bielenberg DR. Chemotherapy generated cell debris stimulate colon carcinoma tumor growth via osteopontin. FASEB J. 2018;33(1):114-1125.
- Feng X, Tian L, Zhang Z et al. Caspase-3 dying tumor cells mediate post-irradiation angiogenesis. Oncotarget. 2015;6:32353-32367.
- Keklikoglou I, Cianciaruso C, Güç E, et al. Chemotherapy elicits pro-metastatic extracellular vesicles in breast cancer models. Nat Cell Biol. 2019 Feb;21(2):190-202. doi: 10.1038/s41556-018-0256-3.
- Sulcinner ML, Serhan CN, Gilligan MM, et al. Resovins suppress tumor growth and enhance cancer therapy. J Exp Med. 2018 Jan;215(1):115-140. doi: 10.1084/jem.20170681.
- Vakkala M, Kahlos K, Lakari E, Pääkkö P, Kinnula V, Soini Y. Inducible nitric oxide synthase expression, apoptosis, and angiogenesis in in situ and invasive breast carcinomas. Clin Cancer Res. 2000 Jun;6(6):2408-16.
- Ambs S, Hussain SP, Harris CC. Interactive effects of nitric oxide and the p53 tumor suppressor gene in carcinogenesis and tumor progression. FASEB J. 1997;11:443–448.

Figure 1: Weight of mice before and after four weeks following inoculation with 4T1 cells and 4T1 cells plus debris

Figure 2: Tumor burden (A) and tumor weight (B) in Group 2 mice as compared to Group 1. (* significance = 0.01)

Figure 3: Photographs of tumors developed in mice injected with 4T1 breast cancer cells (top row) and injected with a
combination of 4T1 breast cancer cells plus cell debris resulting from Docetaxel treatment (bottom row).

4A- Group 1

4B- Group 2
Figure 4: H&E staining of tumors in group 1 (A) and Group 2 (B)

5A- Group 1 (Collagen I)

5B- Group 2 (Collagen I)
Figure 5: Collagen I staining of tumors in Group 1 (A) and Group 2 (B)

6A- Group 1

6B- Group 2
Figure 6: Collagen IV staining of tumors in Group 1 (A) and Group 2 (B)

7A- Group 1 tumor

7B- Group 2 tumor
Figure 7: Proliferation marker Ki67 in tumors developed in mice in Group 2 and Group 1

8A- Group 1

8B- Group 2
Figure 8: Histology staining for the presence of TNF-alpha in tumors developed in Group 2 and Group 1

9A- Group 1

9B- Group 2
Figure 9: Histology staining for the presence of IL-6 in tumors developed in Group 2 and Group 1

10A- Group 1

10B- Group 2
Figure 10: Expression of iNOS in tumors developed in Group 2 (A) mice and Group 1 (B)
A: VEGF

VEGF in Group 1

VEGF in Group 2
B: MMP-2

MMP-2 in Group 1

MMP-2 in Group2
C: MMP-9

MMP-9 in Group 1

MMP-9 in Group 2
Figure 11: Tumors developed in Group 2 mice (injected with 4T1 cells plus debris) had more intense pattern for VEGF, MMP2
and MMP9 as compared to Group 1 mice (injected with 4T1cells only)
References
- Revesz L. Effect of tumor cells killed by X-ray upon growth of admixed viable cells. Nature.1956;178:1311-1392.
- Chang J, Bharsen SS, Bielenberg DR. Chemotherapy generated cell debris stimulate colon carcinoma tumor growth via osteopontin. FASEB J. 2018;33(1):114-1125.
- Feng X, Tian L, Zhang Z et al. Caspase-3 dying tumor cells mediate post-irradiation angiogenesis. Oncotarget. 2015;6:32353-32367.
- Keklikoglou I, Cianciaruso C, Güç E, et al. Chemotherapy elicits pro-metastatic extracellular vesicles in breast cancer models. Nat Cell Biol. 2019 Feb;21(2):190-202. doi: 10.1038/s41556-018-0256-3.
- Sulcinner ML, Serhan CN, Gilligan MM, et al. Resovins suppress tumor growth and enhance cancer therapy. J Exp Med. 2018 Jan;215(1):115-140. doi: 10.1084/jem.20170681.
- Vakkala M, Kahlos K, Lakari E, Pääkkö P, Kinnula V, Soini Y. Inducible nitric oxide synthase expression, apoptosis, and angiogenesis in in situ and invasive breast carcinomas. Clin Cancer Res. 2000 Jun;6(6):2408-16.
- Ambs S, Hussain SP, Harris CC. Interactive effects of nitric oxide and the p53 tumor suppressor gene in carcinogenesis and tumor progression. FASEB J. 1997;11:443–448.

